
Power curves for F150 and F250 6.2L engines
 02-10-2013, 09:32 PM
#1
Senior Member
Thread Starter

Thought some may be interested in seeing how the F250 6.2L torque curve compares to the F150 6.2L.
F250 6.2L Power Curve:

The F150 6.2L Power curve (~ Hp =( torque * rpm)/5252 )

F250 6.2L Power Curve:
The F150 6.2L Power curve (~ Hp =( torque * rpm)/5252 )
Last edited by Mike Up; 02-10-2013 at 09:35 PM.

 02-10-2013, 10:13 PM
#3
Senior Member

I made some graphs here (post 34)
Ecoboost vs 6.2 vs 5.0 HP and Torque
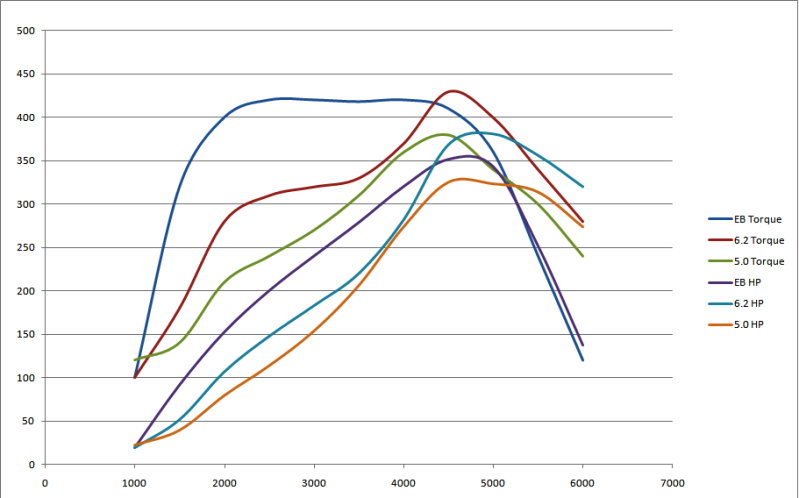
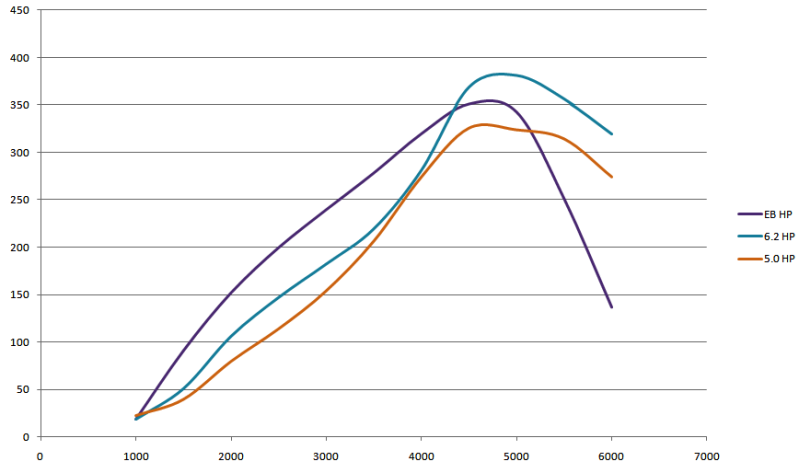
Ecoboost vs 6.2 vs 5.0 HP only
 [/QUOTE]
Ecoboost vs 6.2 vs 5.0 HP and Torque
Ecoboost vs 6.2 vs 5.0 HP only
[/QUOTE]
02-10-2013, 10:29 PM
#5
Senior Member
Thread Starter
I took these pictures myself right out of the marketing hard book at the F150 stand of the dealership. The F250 dyno results were copied right out of the 2012 superduty brochure.
Last edited by Mike Up; 02-10-2013 at 10:31 PM.
02-10-2013, 10:34 PM
#6
Senior Member
Thread Starter
I made some graphs here (post 34)
Ecoboost vs 6.2 vs 5.0 HP and Torque

Ecoboost vs 6.2 vs 5.0 HP only

Ecoboost vs 6.2 vs 5.0 HP and Torque
Ecoboost vs 6.2 vs 5.0 HP only
Where did you get your data. You results don't line up with Ford's flywheel dyno results and they don't line of with either of Pickuptrucks.com rear wheel dyno charts that even ford engineering was a part of. Your chart makes the Eboboost curve look much better than it really is while making the 5.0L and 6.2L curves look much worse than they really are.
Last edited by Mike Up; 02-10-2013 at 10:37 PM.
Trending Topics
02-10-2013, 10:59 PM
#8
Inebriated 4 ur safety
[MENTION=3]Jon[/MENTION]bar
I know that the Ecoboost makes more power than the 6.2L before 4,500 rpms, but those charts look off especially the HP one where the 6.2L should be above 400hp.
I know that the Ecoboost makes more power than the 6.2L before 4,500 rpms, but those charts look off especially the HP one where the 6.2L should be above 400hp.
Last edited by Al Kohalic; 02-10-2013 at 11:10 PM.
02-10-2013, 11:04 PM
#9
These are the actual Ford Flywheel dyno results charted. They are not wheel driven dynos that can have results all over the place.
I took these pictures myself right out of the marketing hard book at the F150 stand of the dealership. The F250 dyno results were copied right out of the 2012 superduty brochure.
I took these pictures myself right out of the marketing hard book at the F150 stand of the dealership. The F250 dyno results were copied right out of the 2012 superduty brochure.


